Houston Cap Rates: Multifamily 5–6.5%, Industrial 5–6%, Auben’s Take
October 5, 2026
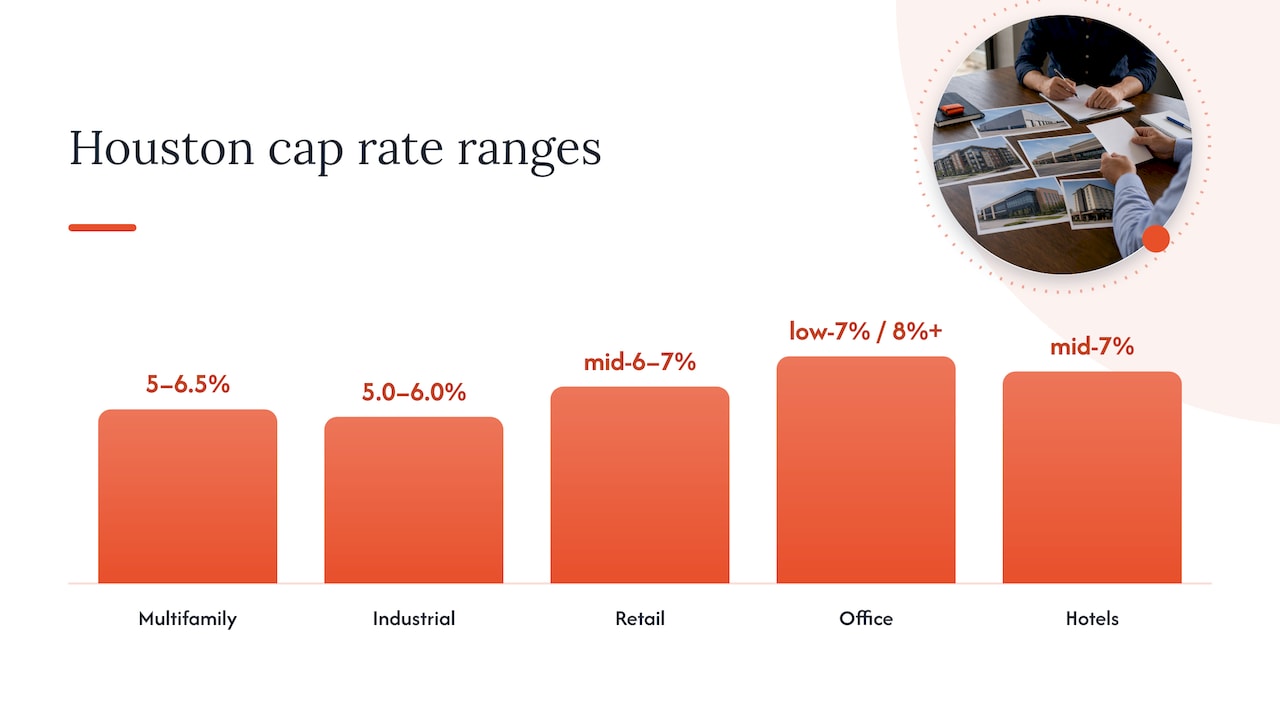
Houston cap rates currently span a wide band by sector: multifamily in a moderate range around 5 to 6.5%, industrial near 5% to 6%, retail somewhat higher, and office and hospitality generally higher still, with Class A CBD office cap rates recently exceeding 8% in some samples. Rates are drifting up on stabilized assets while compressing on well-located industrial. Before you act on any of these ranges, check your submarket and normalize the seller’s NOI with guidance on securing property insurance in Texas.
TL;DR:
- Submarket conditions significantly impact cap rates, with industrial and retail ranges varying based on corridor-level rents and vacancy rates.
- Class A assets typically trade at the lowest cap rates, while Class C and value-add deals often demand higher yields due to renovation and execution risks.
- Concessions such as rent abatements and tenant improvements can overstate reported cap rates if not properly normalized in analysis.
- A 7.5% cap rate in Houston generally indicates higher risk or value-add potential, while 5% suggests strong locations with rent growth expectations.
- Careful due diligence, including adjusting for concessions and local fundamentals, is essential before relying on headline cap rate figures for investment decisions.
Table of Contents
- 1. Current cap rates by sector in Houston
- 2. Submarket variation and asset-class nuance in Houston
- 3. What’s moving Houston cap rates now: rents, vacancy, and financing
- 4. How to use cap rates in underwriting: a step-by-step checklist
- 6. Auben Realty’s on-the-ground perspective on effective yield
- 7. Where the real risk sits for Houston investors right now
- How Auben Realty supports cap-rate due diligence in Houston
- FAQ
- Sources
1. Current cap rates by sector in Houston
Every sector in Houston is telling a different story right now, and lumping them into one “market cap rate” hides the signal you need for underwriting.
Retail has drifted into the mid-6% to 7% range as some centers face re-tenanting risk, while office is the clear outlier.
IRR’s Mid-Year 2025 Viewpoint reported Class A CBD office cap rates rising above 8% in its sample, reflecting both genuine repricing and the broader national reset in office valuations. That same report documented a regional cycle shift favoring southern markets like Houston, which helps explain why capital kept flowing into multifamily and industrial even as office struggled.
- Multifamily: mid-5% to 6.5%, with Class A near the bottom of that band and workforce housing near the top.
- Industrial: 5.0% to 6.0%, among the tightest spreads in the metro.
- Retail: mid-6% to 7%, wider for centers with anchor vacancy risk.
- Office: low 7% for well-leased suburban product, 8%+ for CBD Class A per IRR’s sample.
- Hotels: mid-7% range, reflecting higher operational risk and slower stabilization timelines.
Industrial direct asking rents and corridor-level vacancy data from Cresa’s Q3 2025 Houston industrial report show meaningful variation by corridor, and that variation is the main reason industrial cap rates differ so much from one submarket to the next even within the same broad sector range.
The extreme cases deserve a separate mention. Opportunistic buyers chasing workforce multifamily or value-add retail are underwriting entry yields well above these headline ranges, often 7% or higher, because they are pricing in renovation risk and lease-up uncertainty rather than in-place stabilized income. Treat any cap rate quoted without a class or condition qualifier as incomplete.
2. Submarket variation and asset-class nuance in Houston
A citywide cap-rate range is a starting point, not an answer. Houston’s submarkets move at different speeds, and the spread between a CBD asset and a suburban one in the same sector can run well over 100 basis points.
Industrial is the clearest example. Cresa’s Q3 2025 data shows direct asking rents and vacancy rates that diverge meaningfully across corridors, and those differences flow directly into cap rates. A fully leased building in a tight corridor with low vacancy commands a lower cap rate than a comparable building in a corridor carrying excess supply, even though both sit under the same “Houston industrial” headline. Investors comparing deals across corridors should pull comps from the same corridor whenever possible rather than relying on a metro-wide average.
Class distinctions matter just as much as geography:
- Class A stabilized assets trade at the tightest cap rates because buyers are paying for in-place income with minimal lease-up risk.
- Class B assets usually sit 25 to 75 basis points above Class A in the same submarket, reflecting older systems and more turnover.
- Class C and value-add deals can price well above both, since buyers demand a higher entry yield to compensate for renovation costs and execution risk.
- CBD office and retail generally carry wider cap-rate bands than suburban product right now, a direct result of the office repricing documented in IRR’s mid-year report.
For multifamily specifically, a stabilized suburban Class B property near strong job centers can price tighter than a CBD high-rise facing elevated office-adjacent vacancy, which runs counter to the old assumption that downtown always commands a premium. That shift is worth tracking if you are comparing acquisition targets across Houston’s diverse submarkets, where corridor-level fundamentals now matter more than general location prestige.
3. What’s moving Houston cap rates now: rents, vacancy, and financing
Three forces are driving the current spread in Houston cap rates, and two of them are easy to miss if you only look at a headline rate.
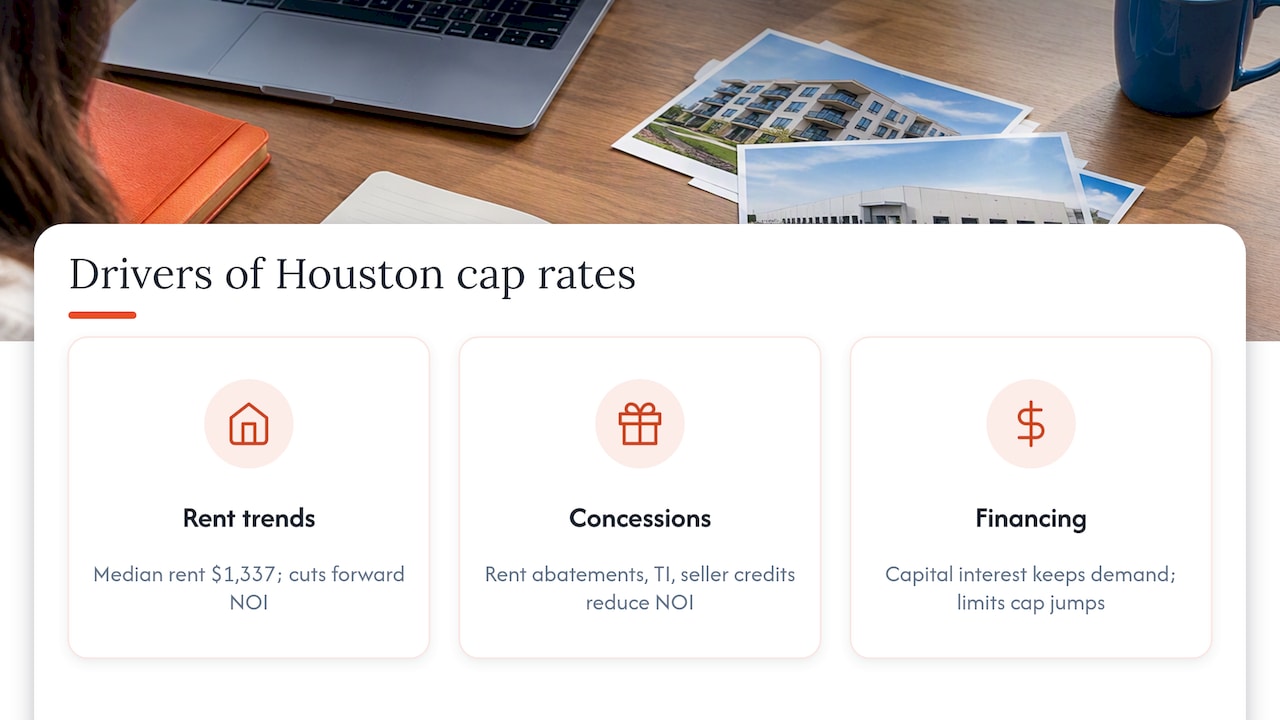
Rent trends are the most direct driver. Realtor put the Houston metro’s median asking rent at around $1,337, down modestly year-over-year. Softer rent growth reduces forward NOI projections, which pushes buyers to demand higher cap rates on stabilized multifamily to hit the same return targets. At the same time, IRR’s mid-year report noted a regional cycle shift favoring southern markets, which has kept capital interested in Houston even as rent growth cooled.
The less obvious driver is concessions. Reporting from GlobeSt in March 2026 documented how sellers are increasingly using rent abatements, larger tenant improvement allowances, and seller-financed credits to keep a deal’s headline price and reported cap rate looking stable, even when the underlying asset has repriced. A seller offering six months of free rent on a new lease, for example, is effectively discounting the deal while keeping the face rent and the reported cap rate unchanged on paper.
This matters because a transactional cap rate built on concession-heavy leases overstates the true in-place yield. If you underwrite the headline number without adjusting for the concession package, you are paying for income that will not materialize once those concessions roll off.
Pro Tip: Convert any large TI allowance or rent abatement into an annualized expense over the lease term, then recalculate the cap rate on that adjusted NOI before you compare it to another deal.
4. How to use cap rates in underwriting: a step-by-step checklist
Treat the reported cap rate as a starting point for your own analysis, not a conclusion. Here is a practical sequence for any Houston acquisition:
- Verify trailing twelve-month NOI against the rent roll and expense statements rather than relying on a broker’s pro forma.
- Strip out and re-add concessions such as free rent, TI allowances, and seller credits as annualized adjustments, per the method GlobeSt’s reporting on concession practices points to.
- Compare the adjusted cap rate to submarket comps, using corridor-level or neighborhood-level data rather than a metro average.
- Run a sensitivity test on exit cap rate assumptions, since even a 50 to 100 basis point shift can materially change your projected return.
- Model at least two financing scenarios, since rate movement changes the spread between your cap rate and your cost of debt.
- Check vacancy and rent trend direction for the specific submarket, using current data such as Realtor, since a declining rent environment erodes forward NOI faster than most pro formas assume.
That is the kind of swing a half-point of cap-rate movement produces, and it is why exit assumptions deserve as much scrutiny as entry pricing.
Watch for these red flags in any marketing package: a cap rate calculated on a pro forma rent roll rather than trailing actuals, concessions buried in a footnote instead of the NOI line, and a cap rate that does not disclose whether it reflects a transaction price or an asking price.
6. Auben Realty’s on-the-ground perspective on effective yield
With many years managing investment properties and numerous properties served across our regional markets, we see the gap between a reported cap rate and the yield an owner actually realizes play out constantly. A property’s effective cap rate is shaped far more by execution than by the number on the offering memo.
The cap rate you underwrite and the cap rate you realize align only if nothing changes in how the property is managed.
Renovation sequencing, lease-up pacing, tenant placement quality, and expense control can all shift NOI after closing, sometimes more than the acquisition price does. Properties bought at the higher end of reported cap rates can sometimes perform better if management improves operations quickly.
Pro Tip: Budget for lease-up and renovation timelines separately from your stabilized cap rate assumption. Underwriting both at once overstates year-one returns.
7. Where the real risk sits for Houston investors right now
The biggest mistake I see is treating a headline cap rate as a finished analysis instead of a starting point that still needs adjusting for concessions, submarket fundamentals, and financing terms. Houston’s upside is real: industrial corridors remain tight and multifamily demand is resilient even with softer rent growth. The risk is paying a stabilized-asset price for a deal that is quietly discounted through concessions you did not strip out.
My direct recommendation: run the full underwriting checklist above on any letter of intent within 48 hours of receiving it, before emotional attachment to the deal sets in.
— MediaBeast
How Auben Realty supports cap-rate due diligence in Houston
Once you have a cap rate you trust, the next question is who closes the gap between projected and realized returns. That is where our Houston property management services come in: handling lease-up, tenant placement, and expense control so the NOI you underwrote has a real path to showing up on the rent roll.

For investors weighing an acquisition, our asset management services provide ongoing oversight of performance against your underwriting assumptions, and our brokerage services can help source and structure deals across our Houston market. If you are weighing a renovation-heavy value-add play, project management support keeps that work on schedule and on budget. Reach out through our Houston page to talk through a specific deal.
FAQ
What is a 7.5% cap rate?
In Houston’s current market, that level sits above typical stabilized multifamily and industrial pricing but within range for hotels and some value-add retail or workforce housing deals.
Are rents going down in Houston?
Houston metro median asking rent was $1,337 in September 2025, down about 3.0% year-over-year, according to Realtor.com’s rental report. That decline has pressured forward NOI projections on multifamily deals and is one reason buyers are demanding higher cap rates on some stabilized assets.
Is 7% a good cap rate?
Compare it to recent transaction comps in the same corridor and asset class rather than treating it as a universal benchmark.
Is 5% a good cap rate?
A 5% entry yield generally signals a premium location or asset with strong rent growth expectations baked into the price, so it warrants extra scrutiny of the underlying NOI assumptions.
Sources
The ranges in this article draw from a mix of broker market reports, an industry research firm’s mid-year local report, and metro rent data, covering roughly the second quarter of 2025 through the first quarter of 2026. Different providers calculate cap rates differently: some report transaction-based caps from closed sales, while others report caps implied by current asking prices, which tend to run softer than actual trades.
- Realtor
- Just Released: IRR’s Mid-Year 2025 Viewpoint Local Market Reports
- Industrial | Q3 2025 Market Report Houston – Cresa
- Core multifamily buyers turn more bullish but don’t loosen their models – GlobeSt
Refresh these figures quarterly, since rent and vacancy data update faster than transaction-based cap-rate surveys.